Abstract
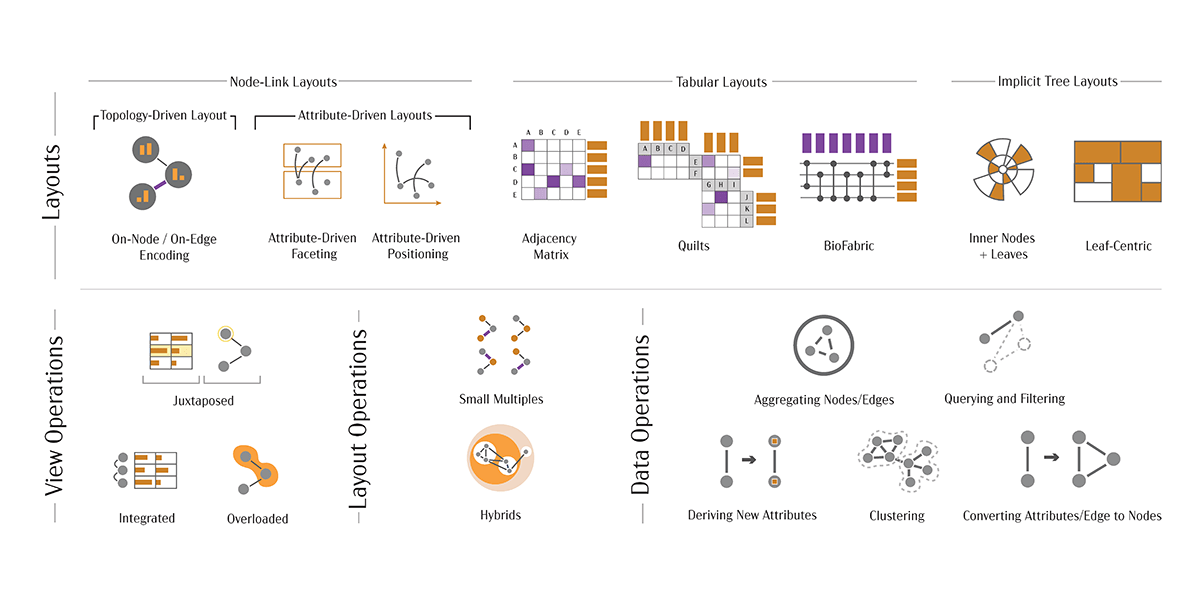
Multivariate networks are made up of nodes and their relationships (links), but also data about those nodes and links as attributes. Most real-world networks are associated with several attributes, and many analysis tasks depend on analyzing both, relationships and attributes. Visualization of multivariate networks, however, is challenging, especially when both the topology of the network and the attributes need to be considered concurrently. In this state-of-the-art report, we analyze current practices and classify techniques along four axes: layouts, view operations, layout operations, and data operations. We also provide an analysis of tasks specific to multivariate networks and give recommendations for which technique to use in which scenario. Finally, we survey application areas and evaluation methodologies.
Citation
Carolina Nobre,
Marc Streit,
Alexander Lex
The State of the Art in Visualizing Multivariate Networks
Computer Graphics Forum (EuroVis), 38: 807-832, doi:10.1111/cgf.13728, 2019.
Acknowledgements
The authors thank members of the Visualization Design Lab for their feedback. This work is funded by the National Science Foundation (OAC 1835904, IIS 1751238, and IIS 1350896), the State of Upper Austria (FFG 851460), the Austrian Science Fund (FWF P27975-NBL), and by the Pro2Future Competence Center for Products and Productions of the Future. Pro2Future is funded within the Austrian COMET Program Competence Centers for Excellent Technologies–under the auspices of the Austrian Federal Ministry of Transport, Innovation and Technology, the Austrian Federal Ministry of Science, Research and Economy and of the Provinces of Upper Austria and Styria. COMET is managed by the Austrian Research Promotion Agency FFG.